PORTFOLIO


Walk Walk Revolution
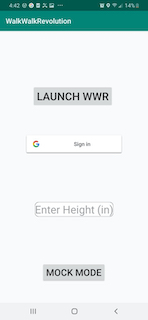
Wanting to make a mobile app and given my school experience with Java, I set out to create an Android app named Walk Walk Revolution. This app had a few core functionalities: being a step/distance tracker and being something that myself and my friends could use. The first screenshot above highlights a few key features of the app. First of all, it includes a Google Sign In option that allows you to sign in using your Google account. This would make it easy for new users to download the app and just start using it, no need for sign up or having to memorize a whole new login. It would also prompt the user to enter their height, so that distance statistics could be accurate based off of both height and the number of steps you've taken that day.
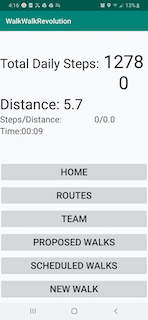
Once the "LAUNCH WWR" button was pressed, the app came alive as you can see in screenshot 2. It started hitting the Google Fit API in order to get the number of steps the person with that Google account had walked that day. I actually loved the simplicity of this part of the app and it gave me a lot of confidence heading into the creation of the social aspect of the app which I knew would prove a lot more difficult. I must note first that the distance figure in the second screenshot is in fact and is a result of me testing the app while running it in the "Mock Mode" you can see in the first screenshot, which would allow me to pass arbitrary values into the app just to check display was working correctly. The app allowed users to create teams of fellow walkers with whom they could share their latest walks and propose "Team Walks" that the entire team could either opt into or out of. This was by far the longest development stage of the entire app and I definitely appreciate all of the experience I got with JSON/GSON, databases and Android dev throughout this time. The backend database used for this was Google Firestore and this gave me a really good introduction to this tool and databases in general (I'll be getting more experience this upcoming quarter when I take my databases course).
Overall, this app was a fantastic introduction to mobile coding and Android Studio. I'm currently thinking up an idea for an iOS app so I'll update this page as soon as that one is done. One things for sure, I'm certainly not done creating things on mobile.

San Diego Police Data Analysis
Attending UC San Diego and inspired by the events of the summer of 2020, I decided to embark on doing an analysis of the San Diego police force's data. I was curious to see if their was an overwhelming racial bias that was highlighted by the data that is publicly provided and has been since San Diego made a push to make this data available in the early 2000s. My research showed that this push was made due to an investigation by the Department of Justice and made me wonder even more what the data had to say.
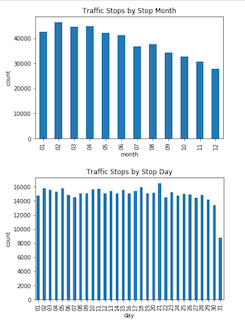
I've included a screenshot of the data analysis here that I found extremely interesting. The screenshot shows both the number of traffic stops by month and another graph that shows stops vs. the day of the month. There is a belief that as police get to the end of the month, they have a quota to fulfill and therefore they start to make more traffic stops. As you can see from the graph, this simply isn't the case and I was actually really excited that this data could easily disprove a myth that even my parents believe! That being said, be wary on the 21st of the month, police do seem to be exceptionally vigilant on that day!


Arsenal Game Predictor
Like I mentioned previously in my About Me section, I have a huge love for the English football team Arsenal. With this love comes a whole lot of nerves during the game. However, with data comes solace and I found that knowing that Arsenal would have an X% chance of winning at the end of the game made my in-game nerves a little less. Using Python web-scraping techniques where data was taken from fivethirtyeight, I found that for ANY game that Arsenal played over the season, I could easily find their percentage chance of winning. I want to be sure to give fivethirtyeight the credit for coming up with the formula to make the predictions, and for any football/soccer fan curious about the data points they take into account, take a look at this page.
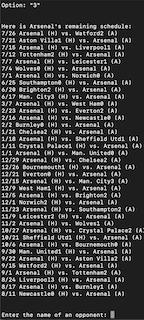
The four screenshots shown above, show the progressional input that will allow the program to decipher the data the user really wants to know. The user can asks the program for 3 things: 1) Chance of their team winning the title. 2) Getting the win probability for any of their favorite team's remaining fixtures. And finally, 3) Get the entire list of win probabilities for ALL of the teams remaining fixtures. In the screenshot example shown above, I chose option 2 and wanted to see the win probability vs. Chelsea away, a game Arsenal have historically done poorly in. (Quick note is that because the 19/20 season has actually finished, I changed the program to use the completed games of the 19/20 season because predictions for the 20/21 season aren't currently available). I chose Arsenal's game against Chelsea because it was one of their best games of the year, and while they didn't manage to achieve the improbable, they did actually tie the game even after getting a man sent off in the first half so it was a memorable game to say the least. As soon as the 20/21 predictions are out, the first thing I'm doing is using the predictor to calculate Arsenal's chances of making it back to the Champions League. Got to be positive even if recent years haven't been so great!